
Methods
I downloaded and used HDI values from the 2022 report, which contains data up to 1990, and values for 1975-1985 from the 2009. Then successively added any missing data from reports starting from 2008 to 1990, since some values (specifically from some socialist nations) are deleted in the latter reports. Note that data before 1990 uses a different methodology, which explains the jagged line. Finally, I used linear regression to complete any countries that only missed a single data point.
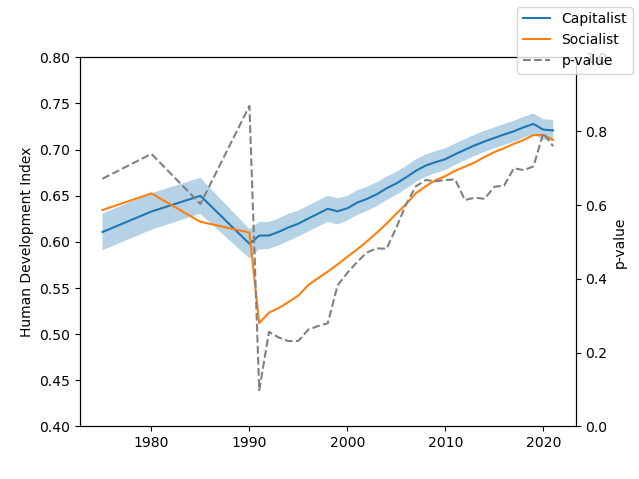
Then, I computed the average of all capitalist and socialist countries that existed at the end of each year, and plotted it. For capitalist countries, I also plotted the standard error (it’s too large to represent for socialist countries).
The dashed line is the p-value computed via the Mann–Whitney U test, which is the probability (out of 1) that comparing random countries from both groups would not show any difference. That is, the closer to 0, the more likely it is that there is an actual difference between the groups.
Limitations
- The HDI reports are missing lots of data, especially from the first decades. This could have been subject to selective reporting.
- Means and p-value are computed without weighting by population. Either doing or not doing it may introduce different biases.
- A mean might not be the best way to quantify the behavior of a wildly varied set of countries.
- While the HDI is computed in such a way that taking means makes sense, there may be biases in its calculation.
It’s gonna surpass them in no time
It might be a good idea to demarcate the change in methodology in 1990 on the graph in some way.
Yes, good point. A simple
matplotlib.pyplot.annotatewould have done the job, didn’t think it through.
What does this measure
It’s the average HDI (which combines some general development indicators, and goes from 0 to 1) of capitalist and socialist countries at the end of each year. The dashed line is the p-value, which is the probability that whatever difference between the two lines would disappear if there were more countries to average in each of the groups (i.e., a lower value indicates that some actual mechanism is causing the difference).
