
I keep some of my org-mode files under version control (more than one repository, and not all are version controlled). This is a gource visualization of the activity on org-mode files from a couple of areas that are highly active and tracked in git.
I keep some of my org-mode files under version control (more than one repository, and not all are version controlled). This is a gource visualization of the activity on org-mode files from a couple of areas that are highly active and tracked in git.
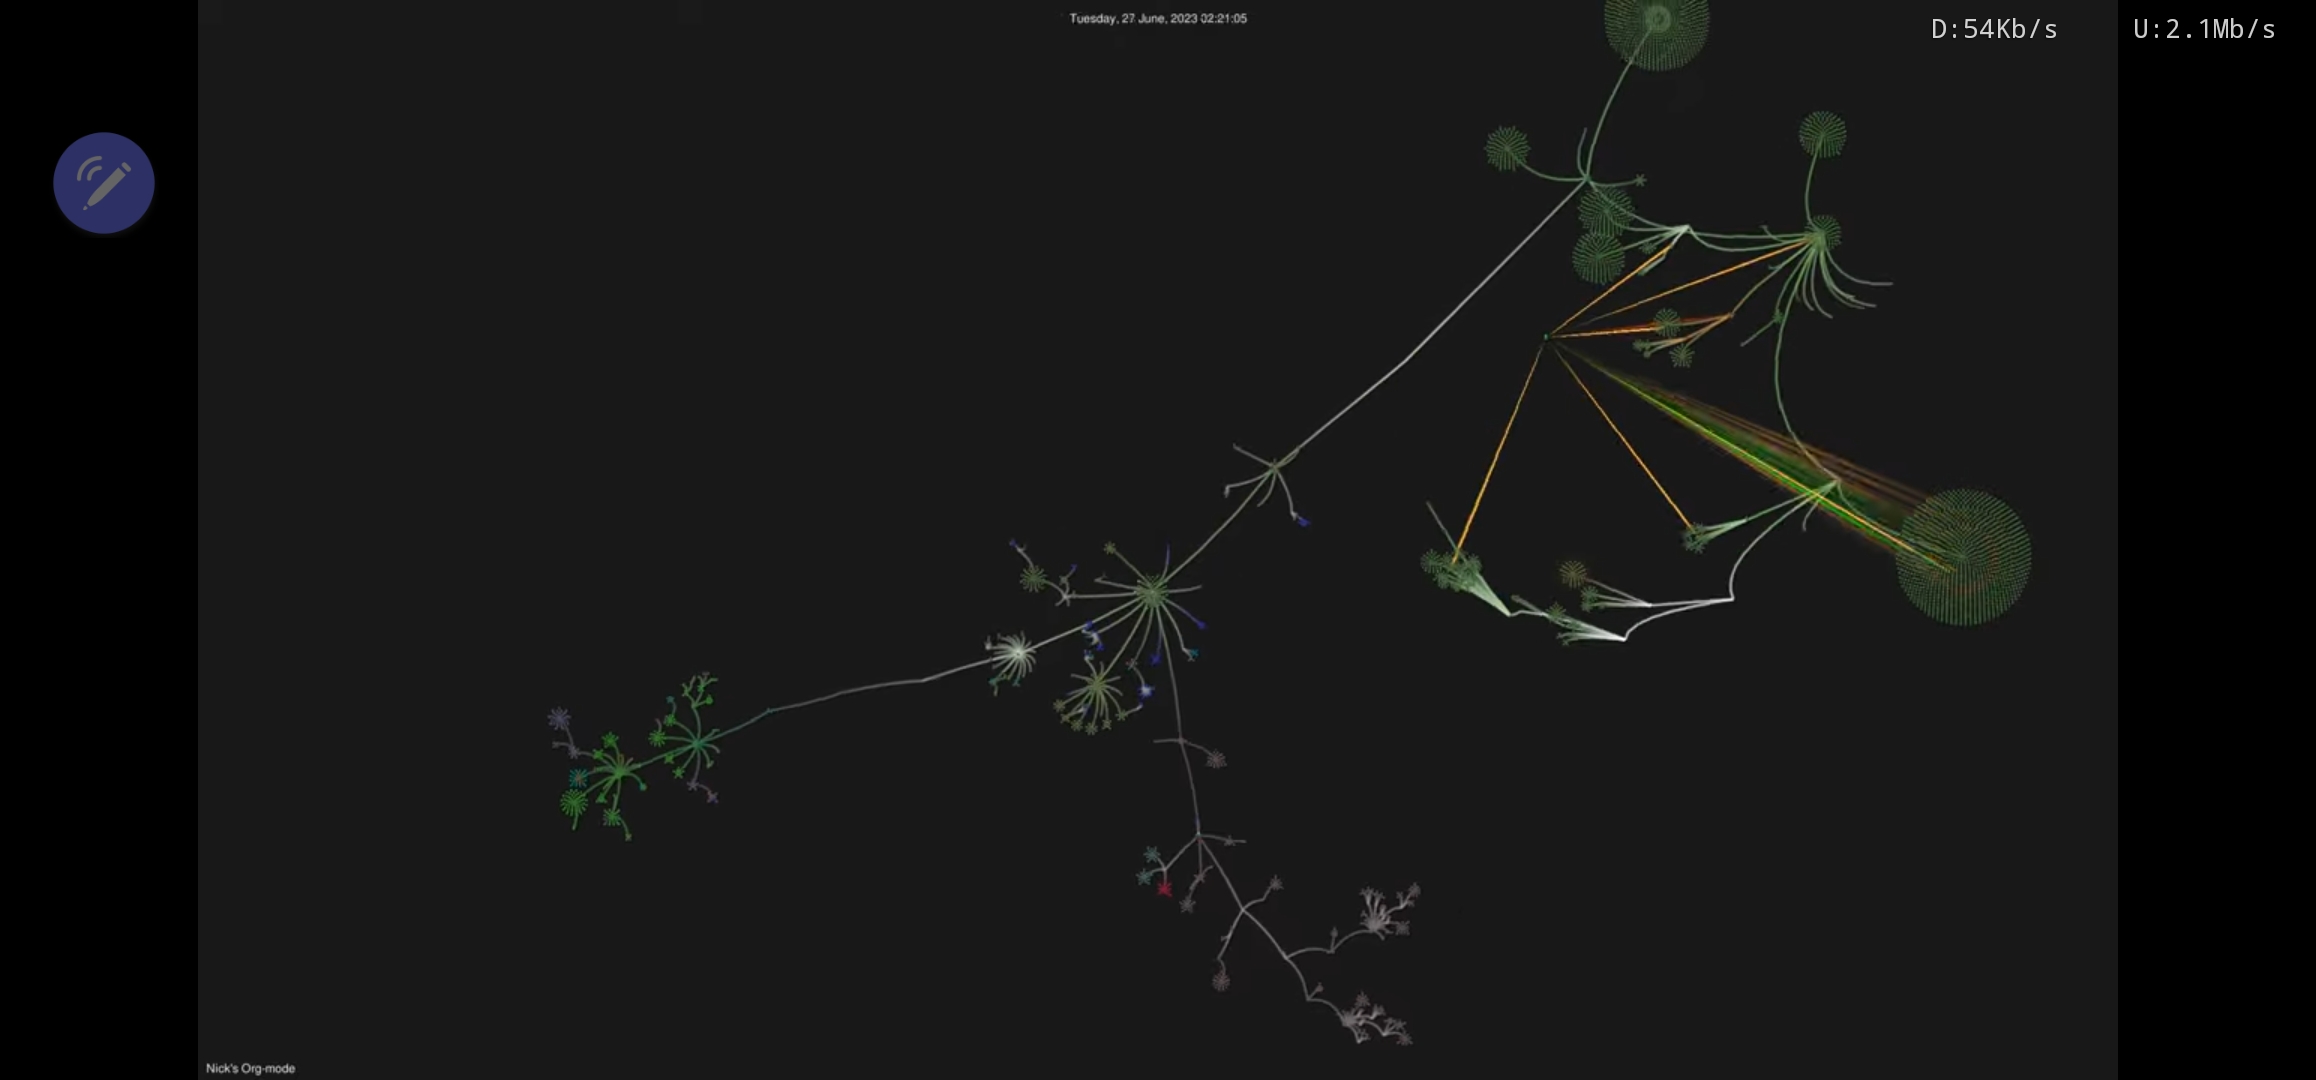
It’s showing part of my collection of org-mode files over time. Files are the dots at the edge, directories are where the branches are. Most of this visualization is prior to me starting to use org-roam. I started using org-roam back in 2020/2021 but that part of my org-mode files was not tracked under version control until a few months ago, it’s obvious in the visualization near the end when a big green bloom is born and quickly grows.
So, it’s nothing to do with complexity per say, but volume of files and parts of my notes where I am active over a period of time.
Make more sense?